This article is for those who want to simplify data integration between Google Analytics (GA4) and Google Sheets.
By using the official Google Add-On, you can easily import data into Google Sheets and leverage it for analysis and visualization.
In this guide, we’ll walk you through the steps of using the “GA4 Reports Builder for Google Analytics” add-on to import GA4 data into your spreadsheet.
TOC
About the Google Analytics Official Add-On
The official Google Analytics add-on, “GA4 Reports Builder for Google Analytics,” is a convenient tool that allows you to easily import GA4 data into Google Sheets.
With this add-on, you don’t need to manually configure the Google Analytics Reporting API, making it simple to fetch data.
Advantage
Drawbacks
No need to manually configure the API settings. Data can be automatically updated. Easy data sharing across the entire team. Flexible data analysis through integration with Google Sheets.
Menus and settings are only available in English. Loading times may be longer when handling large volumes of data.
Advantage of Integrating GA4 Data with the Add-On
The integration offers several advantages, such as automatic data updates, flexible data analysis through the combination with other spreadsheet functions, and easy sharing across the team.
Key metrics like user count, event count, and page views from GA4 can be effortlessly imported into Google Sheets, making data analysis much simpler.
Drawbacks
The ability to customize the data retrieved is limited, meaning not all GA4 metrics and dimensions can be flexibly imported.
When handling large volumes of data, the loading time in Google Sheets may become significantly longer.
Steps
Installing the Add-On
STEP
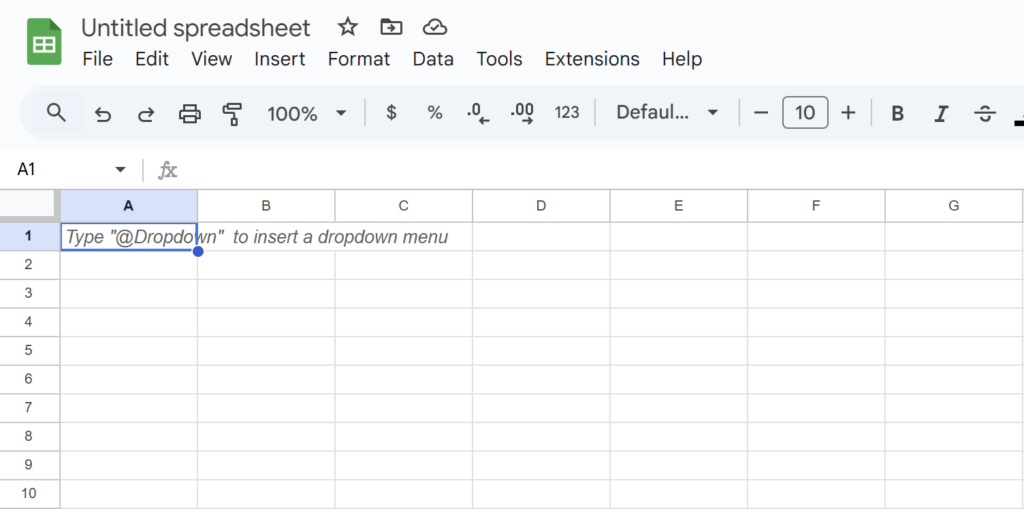
Open Google Sheets
Start by opening a new Google Sheet.
STEP
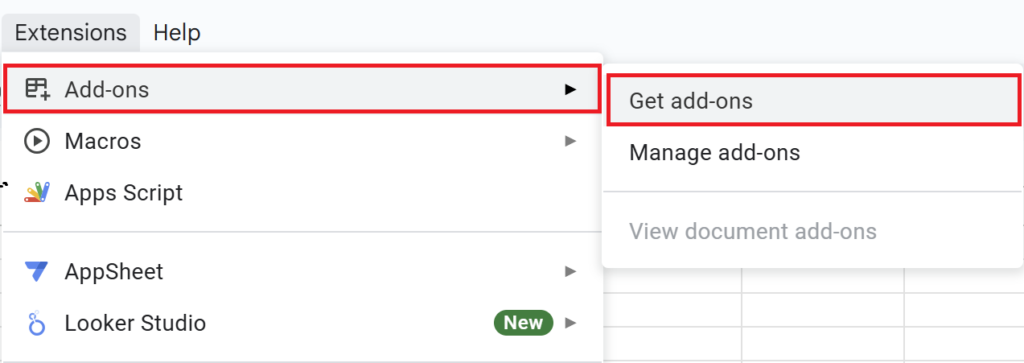
Click “Get Add-ons”
From the Extensions menu, select “Add-ons” > “Get add-ons.”
STEP
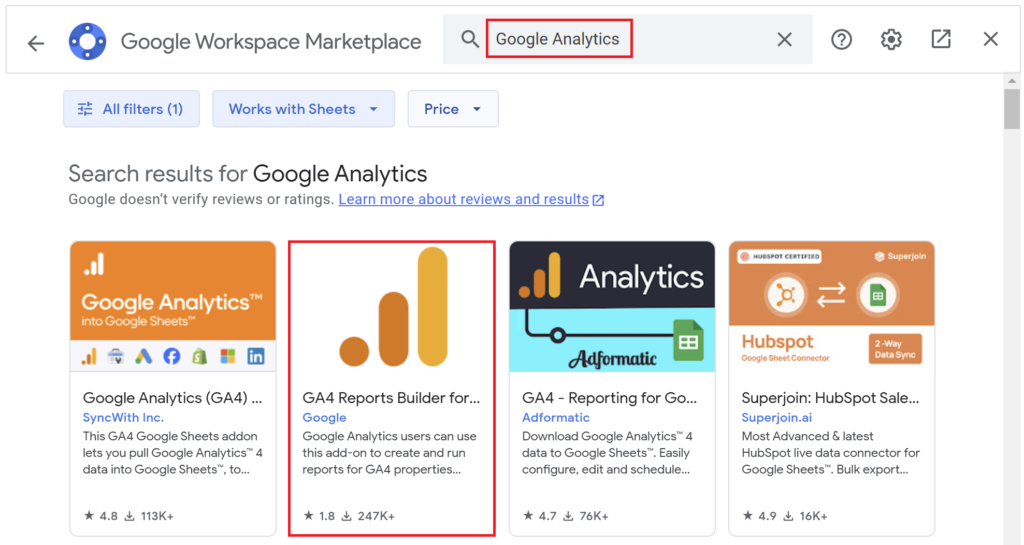
Install the Official Add-On: “GA4 Reports Builder”
In the search bar, type “Google Analytics” and search for it.
Several options will appear, but the official add-on by Google is “GA4 Reports Builder for Google Analytics.”
Install the add-on.
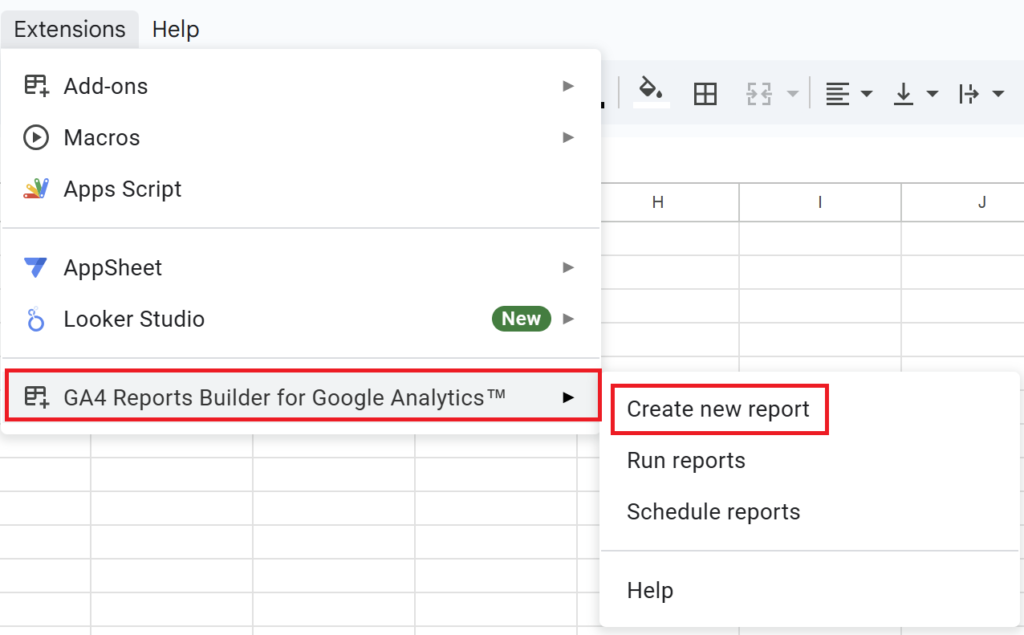
Once installed, “GA4 Reports Builder” will appear in the Extensions menu.
Creating a Report and Importing Data
STEP
Open “Create New Report”
From the Extensions menu, select “GA4 Reports Builder” and click “Create New Report” to create a new report.
If prompted to authenticate your Google account to access the GA4 property, follow the instructions to complete the authentication process.
STEP
Report Configuration
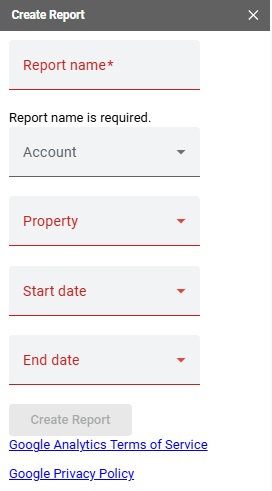
A report configuration panel will appear on the right side of the spreadsheet.
Enter a Report Name
Provide a name for the report to clearly indicate what it represents.
Select an Account
From the dropdown list, choose the Google Analytics account associated with the data you want to import.
Select a Property
From the dropdown list, choose the property you want to use in the report.
Set Start and End Dates
Specify the time period for the data you want to retrieve:
today
yesterday
NdaysAgo
specific date
If you choose “specific date,” you can select the date from a calendar.
Dimensions
Dimensions are attributes or criteria used to organize or categorize data.
Select the dimensions for the data you want to retrieve (e.g., Date, Region, etc.).
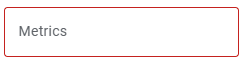
Metrics
Metrics represent quantitative data points or measurements.
Choose the metrics for the data you want to retrieve (e.g., Pageviews, Users, etc.).
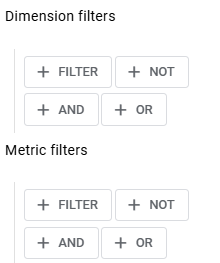
Set Filters
Configure filters to extract specific data for your report.
For example, you can add filters such as “Show traffic only from a specific region” or “Include only a specific page” to narrow down the data for your analysis.
STEP
Click “Create Report”
Once all the settings are configured, click the “Create Report” button to generate the report.
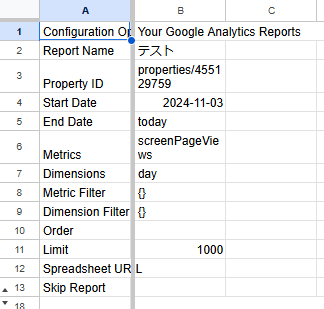
A new sheet will be created, containing the report’s configuration details based on the specified metrics and dimensions.
STEP
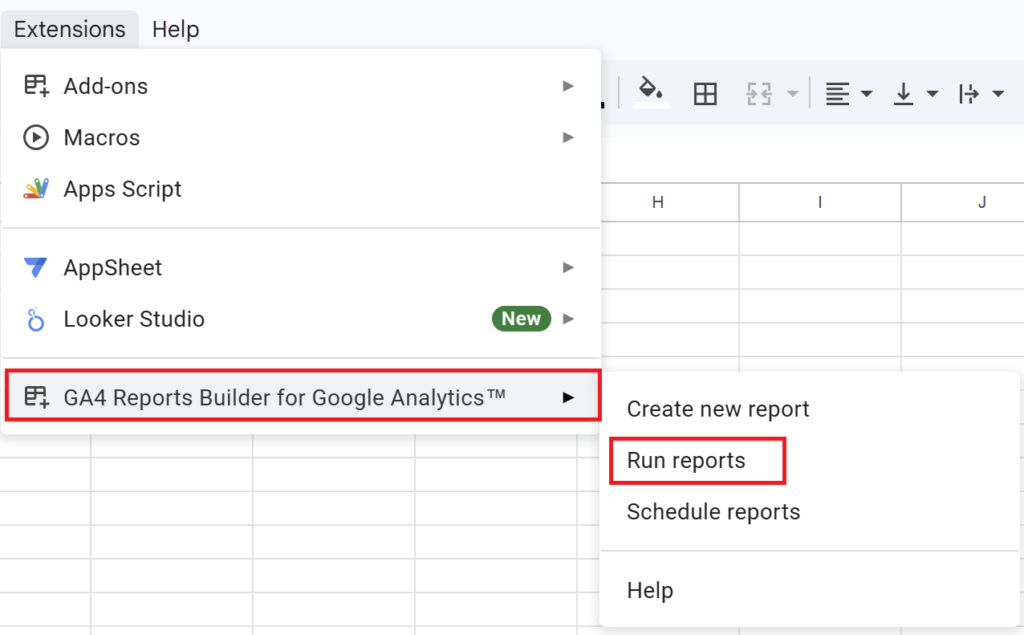
Run the Report
From the Extensions menu, select “GA4 Reports Builder” and click the “Run Reports” button to import GA4 data into the spreadsheet in the specified format.
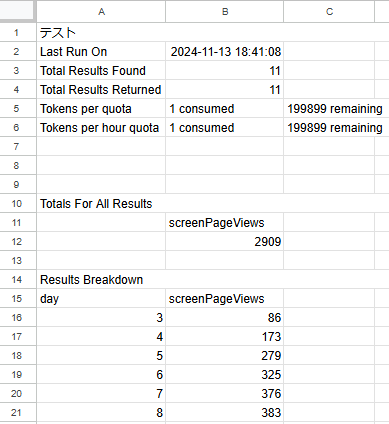
For example, if you want to view pageviews for a specific period, configure the settings accordingly.
Example Configuration
Report Name: Test
Account: GA4 Account
Property: GA4 Property
Start Date: Specific date (11/03/2024)
End Date: Today
Dimensions: Day
Metrics: Screen Page Views
Report Details
The report will display:
Total pageviews for the specified period
Daily pageviews
Automatic Data Updates
The add-on also includes a feature for automatic data updates.
By using “Schedule Reports,” you can set the frequency of updates (e.g., daily or weekly) to ensure your data is refreshed automatically.
STEP
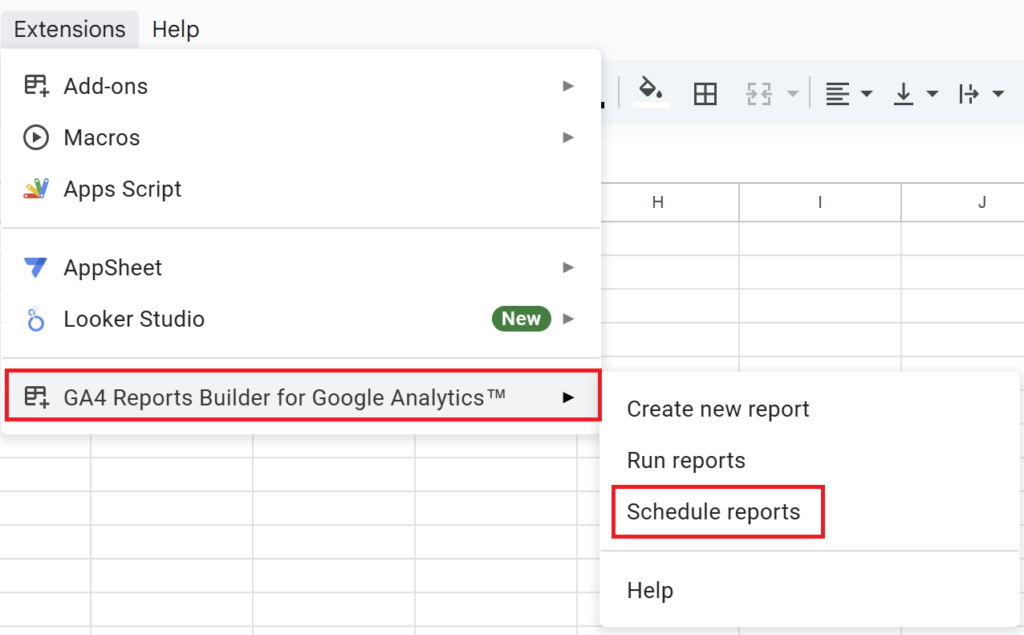
Open “Schedule Reports”
From the Extensions menu, select “GA4 Reports Builder” and click the “Schedule Reports” button.
STEP
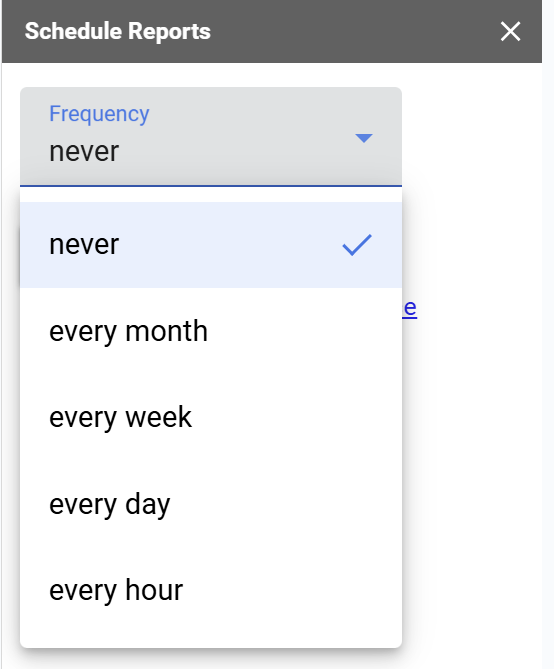
Set Update Frequency
Choose the update frequency from the dropdown list:
never
every month
every week
every day
every hour
Conclusion
Using Google’s official add-on, “GA4 Reports Builder for Google Analytics,” you can easily import GA4 data into Google Sheets.
By setting a schedule, you can automate data updates, eliminating the need for manual execution each time.
In addition to this add-on, you can also integrate Google Sheets with GA4 using tools like Google Apps Script (GAS) or Google Looker Studio.
Integrating GA4 with Google Sheets simplifies data visualization and facilitates seamless sharing within your team.
Our company offers support for improving work efficiency through the use of Google Apps Script. If you need assistance with Google Apps Script customization or error resolution, please feel free to contact us. We are fully committed to supporting your business improvements.


Comments